El Niño Climate Cycle Set to Reshape Global Solar Yield Through 2026
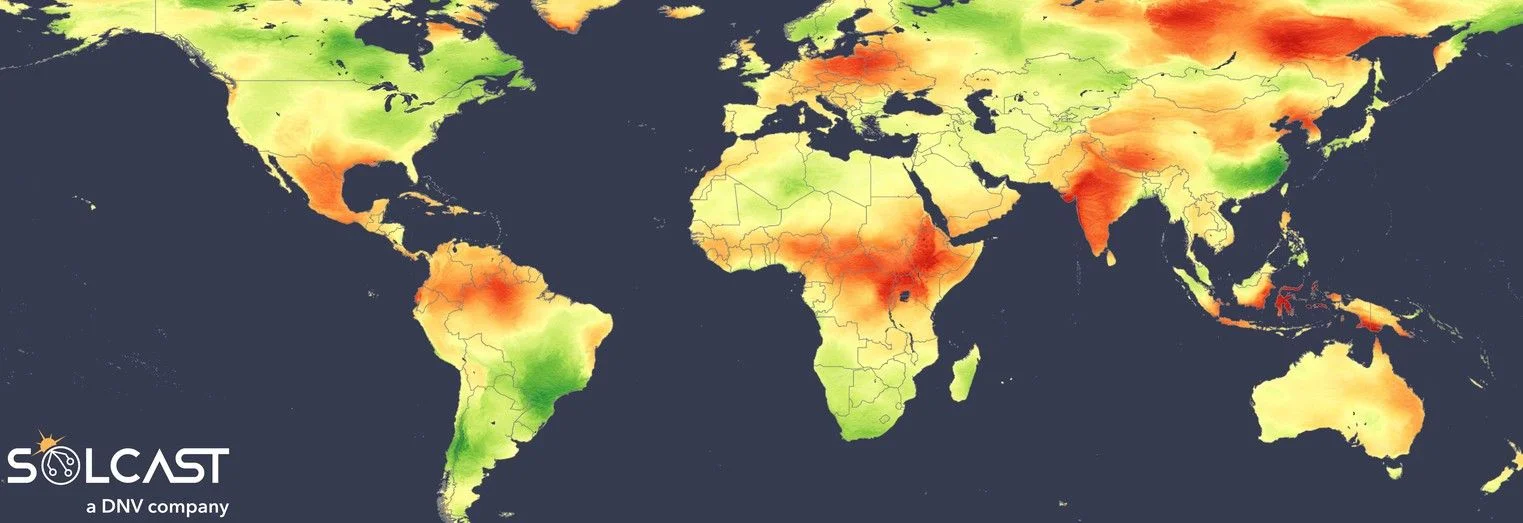
An intensifying El Niño weather pattern is projected to disrupt global solar irradiance distribution through 2026, generating notable generation surges across India and East Australia while triggering sharp asset production declines throughout South America and East Asia.
Key Highlights
- Solar Shifts: The developing El Niño redistributes global cloud density and rainfall patterns instead of reducing uniform planetary sunshine.
- Indian Expansion: Key solar production hubs in India like Rajasthan face irradiance surges up to 15% above historic averages.
- Regional Declines: Asset developers in western South America and eastern China face lower irradiance averages reaching 10% below normal.
- Corporate Market Shifts: Amid changing climates, firms like Nextpower expand international asset capabilities through strategic acquisitions worth $378 million.
An intensifying El Niño climate pattern is projected to strengthen through 2026, shifting planetary solar irradiance distributions by delivering localized resource spikes across India, eastern Australia, and sectors of Africa and Central America, alongside concurrent output drops throughout South America and East Asia.
These regional shifts reflect established historical trends documented during previous major weather anomalies, where broad atmospheric circulation shifts redistribute cloud shields and rainfall across the globe rather than causing a uniform absolute change in total planetary solar resources.
Recent atmospheric metrics and sea surface thermal tracking confirm that El Niño is currently active, a status verified by global meteorological agencies. The Niño 3.4 index has officially crossed the 0.8°C threshold, indicating substantial ocean warming throughout the central Pacific zone.
Predictive seasonal models indicate sustained ocean warming, suggesting this climate trend will strengthen and maximize its physical intensity during the final months of the year. As the event progresses, massive atmospheric shifts alter global cloud formations and precipitation zones.
During prior intense cycles, the most dramatic regional changes in solar irradiance recorded between July and September reached approximately 10%. Because El Niño historically peaks near the end of the calendar year, generation impacts will likely escalate as the phenomenon intensifies through the Northern Hemisphere winter.
India exhibits some of the clearest solar generation increases during active El Niño cycles. Data from prior intense events reveals that major portions of the country recorded irradiance up to 10% higher than non-El Niño years.
These gains expanded up to 15% above baseline metrics in Rajasthan, a primary territory for utility-scale deployment that hosts multiple ultra-large photovoltaic installations.
Eastern Australia similarly encounters clearer atmospheric conditions, lifting regional irradiance averages by roughly 5%, though this specific localized trend presents lower historical consistency.
At Toowoomba, certain intense climate years pushed generation metrics well above traditional boundaries, while other cycles remained near standard historical averages, demonstrating the secondary influence of alternative environmental forces such as shifting Indian Ocean variables.
Conversely, alternative global markets experience diminished solar generation resources during intense El Niño intervals. Western and southern boundaries of South America record the most pronounced generation drops, with local solar irradiance diving roughly 10% underneath non-event historical benchmarks.
Sectors of East Asia experience a less intense but still notable resource contraction, with eastern China absorbing increased precipitation and depressed sunlight levels across major industrial hubs like Shanghai.
These global data maps emphasize that El Niño shifts existing solar potential from one geographic zone to another rather than shifting overall planetary resource levels. For the current cycle, this indicates superior operating conditions for photovoltaic assets across sections of India, East Australia, equatorial Africa, and Central America.
Concurrently, commercial solar assets anchored in western and southern South America alongside eastern China face a higher statistical probability of reduced annual generation yields. Local operational impacts will ultimately depend on how specific atmospheric changes manipulate cloud density, causing variations from site to site.
Analytical firm Solcast compiles these regional insights by monitoring cloud movements and atmospheric aerosols at a 1-2km global resolution, utilizing satellite imagery paired with proprietary machine learning frameworks.
The resulting data streams feed high-resolution irradiance models, allowing the organization to determine resource levels with a localized structural bias below 2% alongside short-term cloud tracking. This diagnostic infrastructure serves more than 350 global enterprises managing over 300 GW of active operational solar infrastructure worldwide.
The analytical viewpoints and interpretations featured in this evaluation belong entirely to the contributing author and do not automatically mirror the institutional positions maintained by pv magazine.
This informational material is protected by copyright regulations and cannot be republished. Organizations seeking collaborative content reuse frameworks must contact the editorial department at editors@pv-magazine.com.
Future Outlook for Global Solar Infrastructure
As climate volatility shifts regional generation yields, the global solar industry is undergoing an operational transformation. Recent market surveys conducted by Vireo Ventures and pv magazine across 91 clean energy startups indicate that 96% of emerging innovators now tie their software or hardware solutions directly to battery storage integration, while 60% target photovoltaic assets. Nearly half of these organizations utilize software-as-a-service models to help asset managers mitigate risk and optimize performance amid volatile environmental trends.
Concurrently, consolidation is accelerating across mature supply chains to bolster asset resilience. US tracker specialist Nextpower has finalized a $378 million (€330 million) cash-and-stock acquisition of German mounting supplier Zimmermann PV Steel Group. This corporate expansion adds 20 GW of historical project expertise and expands Nextpower’s footprint across 15 European nations. By integrating fixed-tilt mechanisms, carports, and agrivoltaic structural components, developers seek to optimize hardware durability against changing regional weather profiles driven by shifting macro-climate cycles.
FAQs
How does El Niño affect solar power generation in India?
During strong El Niño periods, India experiences significantly reduced cloud cover and rainfall, boosting solar irradiance. Most of the country sees gains up to 10% above normal, while major solar deployment regions like Rajasthan can experience resource increases reaching 15% above average.
Which regions experience the largest drops in solar energy potential during El Niño?
Western and southern South America face the most distinct reductions, with solar irradiance dropping roughly 10% below historical averages. Parts of East Asia, particularly eastern China locations such as Shanghai, also experience increased rainfall and lower solar yields.
What technology is used to track these global solar irradiance shifts?
Climatic tracking is conducted by specialized analytics firms using satellite observations and advanced AI machine learning algorithms to monitor clouds and aerosols at a 1-2km resolution. This data allows asset managers to forecast irradiance with a standard bias of less than 2%.